In today's session, we delve into the trading landscape of the stock market, analyzing key trends and setups that can guide your trading decisions. Join us as we explore trading strategies, performance metrics, and the essential tools for navigating the stock market effectively.
Table of Contents
- 🚀 Introduction to Rocketalgo and Today's Session
- 📈 Market Overview: Key Charts to Analyze
- 🔍 Understanding the Rocketalgo Setup
- 📊 Analyzing Market Conditions: A, B, C, M, P Setup
- 💡 Identifying Trade Opportunities
- ⚠️ Navigating Risk in Trading
- 📈 The Current State of Nifty and Bank Nifty
- ⏰ Market Opening Strategy: Timing is Key
- 🛢️ Crude Oil and Gold Market Analysis
- 🚀 Future Features and Enhancements in Rocketalgo
- 🔚 Conclusion and Q&A Session
- ❓ FAQ
🚀 Introduction to Rocketalgo and Today's Session
Welcome to our daily market overview! Today, we will dive deep into how Rocketalgo has performed and identify which trades to consider and which to avoid. Our structured approach allows us to analyze the stock market effectively, bringing clarity to your trading decisions.
Rocketalgo is designed to simplify the trading process, providing you with the right tools to navigate the complex world of stocks. We will review key charts and setups that are essential for today’s trading environment.
📈 Market Overview: Key Charts to Analyze
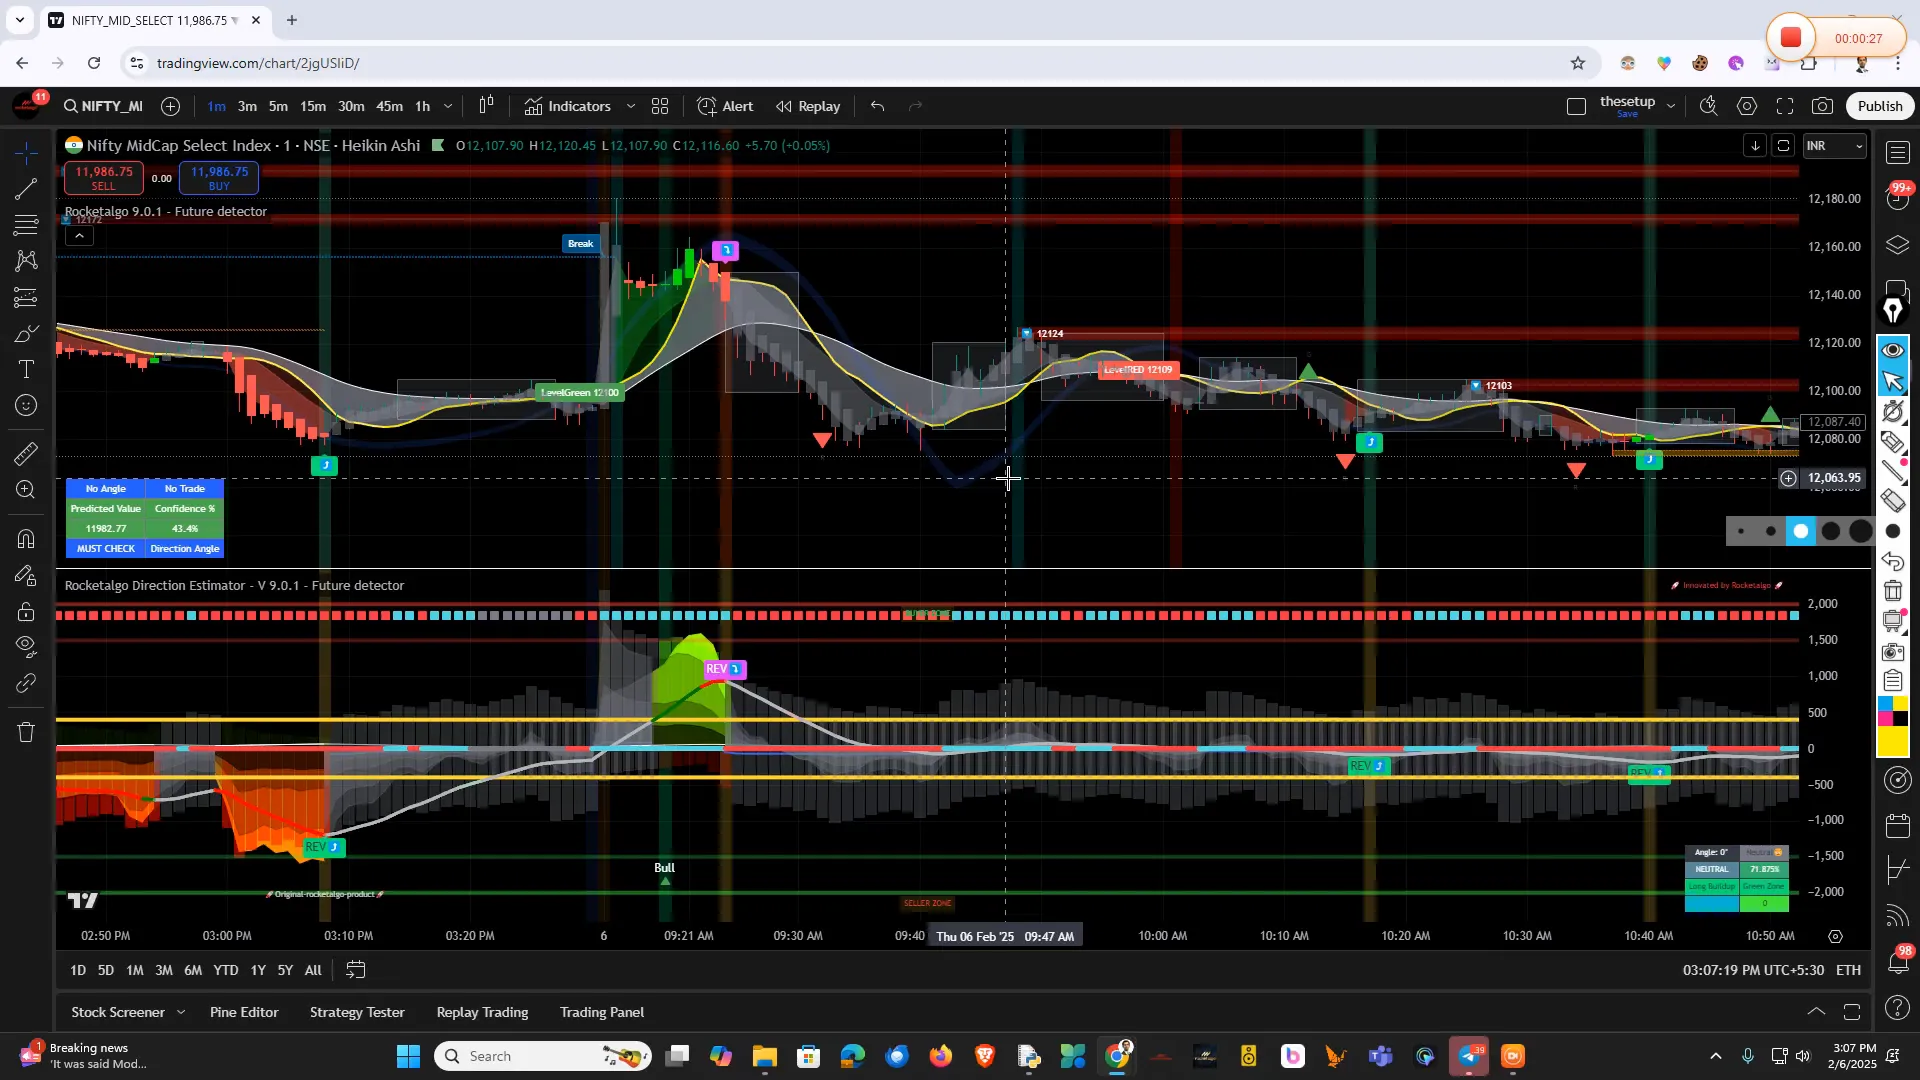
Let’s start with a look at the mid-cap index. Analyzing the Nifty Mid Cap chart, we can identify trends that could present trading opportunities.
Following the mid-cap, we will examine the Nifty and then the Bank Nifty. Each of these indices gives us insights into market sentiment and potential price movements. We will also take a moment to review crude oil and USD trends, as they can significantly impact trading decisions.
🔍 Understanding the Rocketalgo Setup
The Rocketalgo setup follows a simple yet effective formula: A for Angle, B for Breakout, C for Candle, M for Money Flow, and P for Percentage. Recently, we added a new feature: D for Detector.
The Detector helps us visualize market direction more clearly. Its continuous color changes indicate shifts in momentum, allowing traders to make informed decisions. However, if our ABCMP conditions aren’t met, the Detector’s color changes become irrelevant.
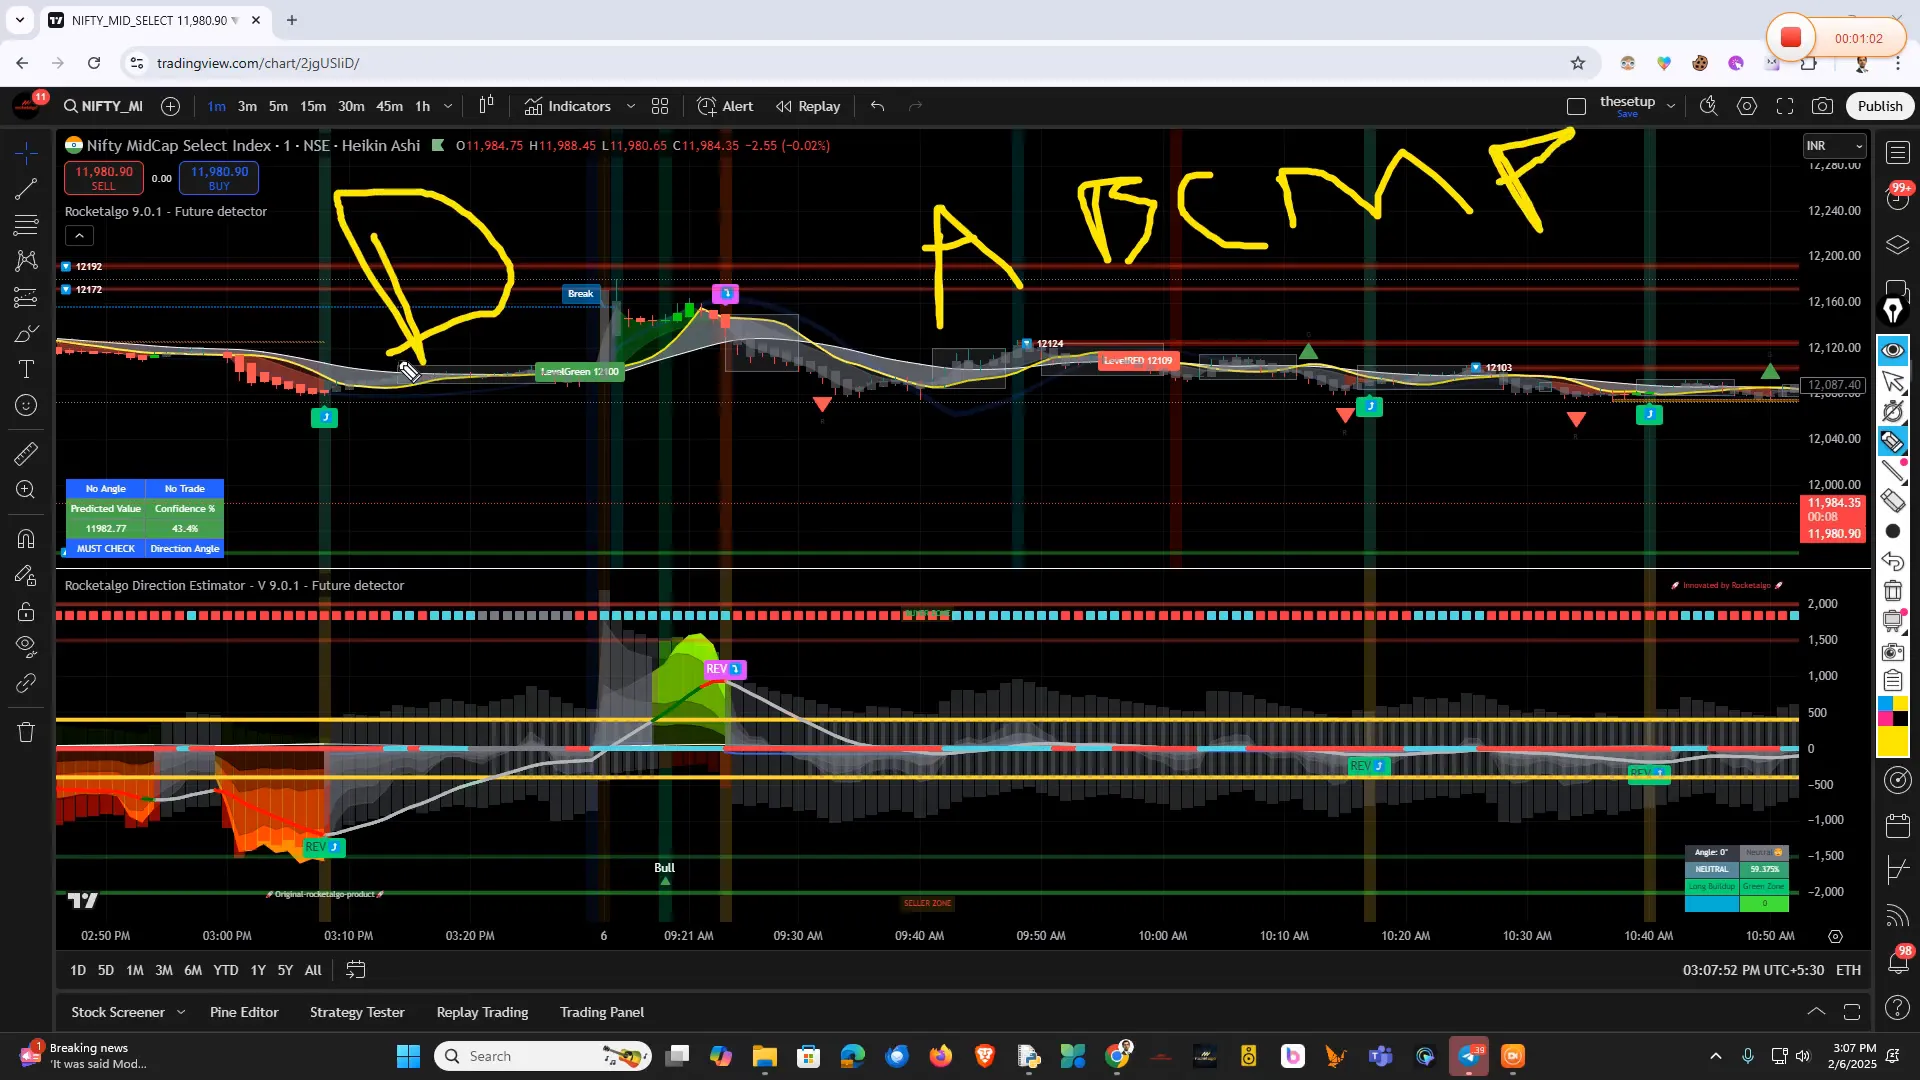
📊 Analyzing Market Conditions: A, B, C, M, P Setup
Let’s break down the ABCMP setup. The Angle (A) indicates the market's direction. A strong angle suggests a solid trend, while a weak angle signals potential reversals. The Breakout (B) confirms that the price has moved beyond a resistance level.
Next, we look at the Candle (C). The candles should be climbing like stairs in an uptrend or descending in a downtrend. If they aren't, we need to be cautious about entering trades.
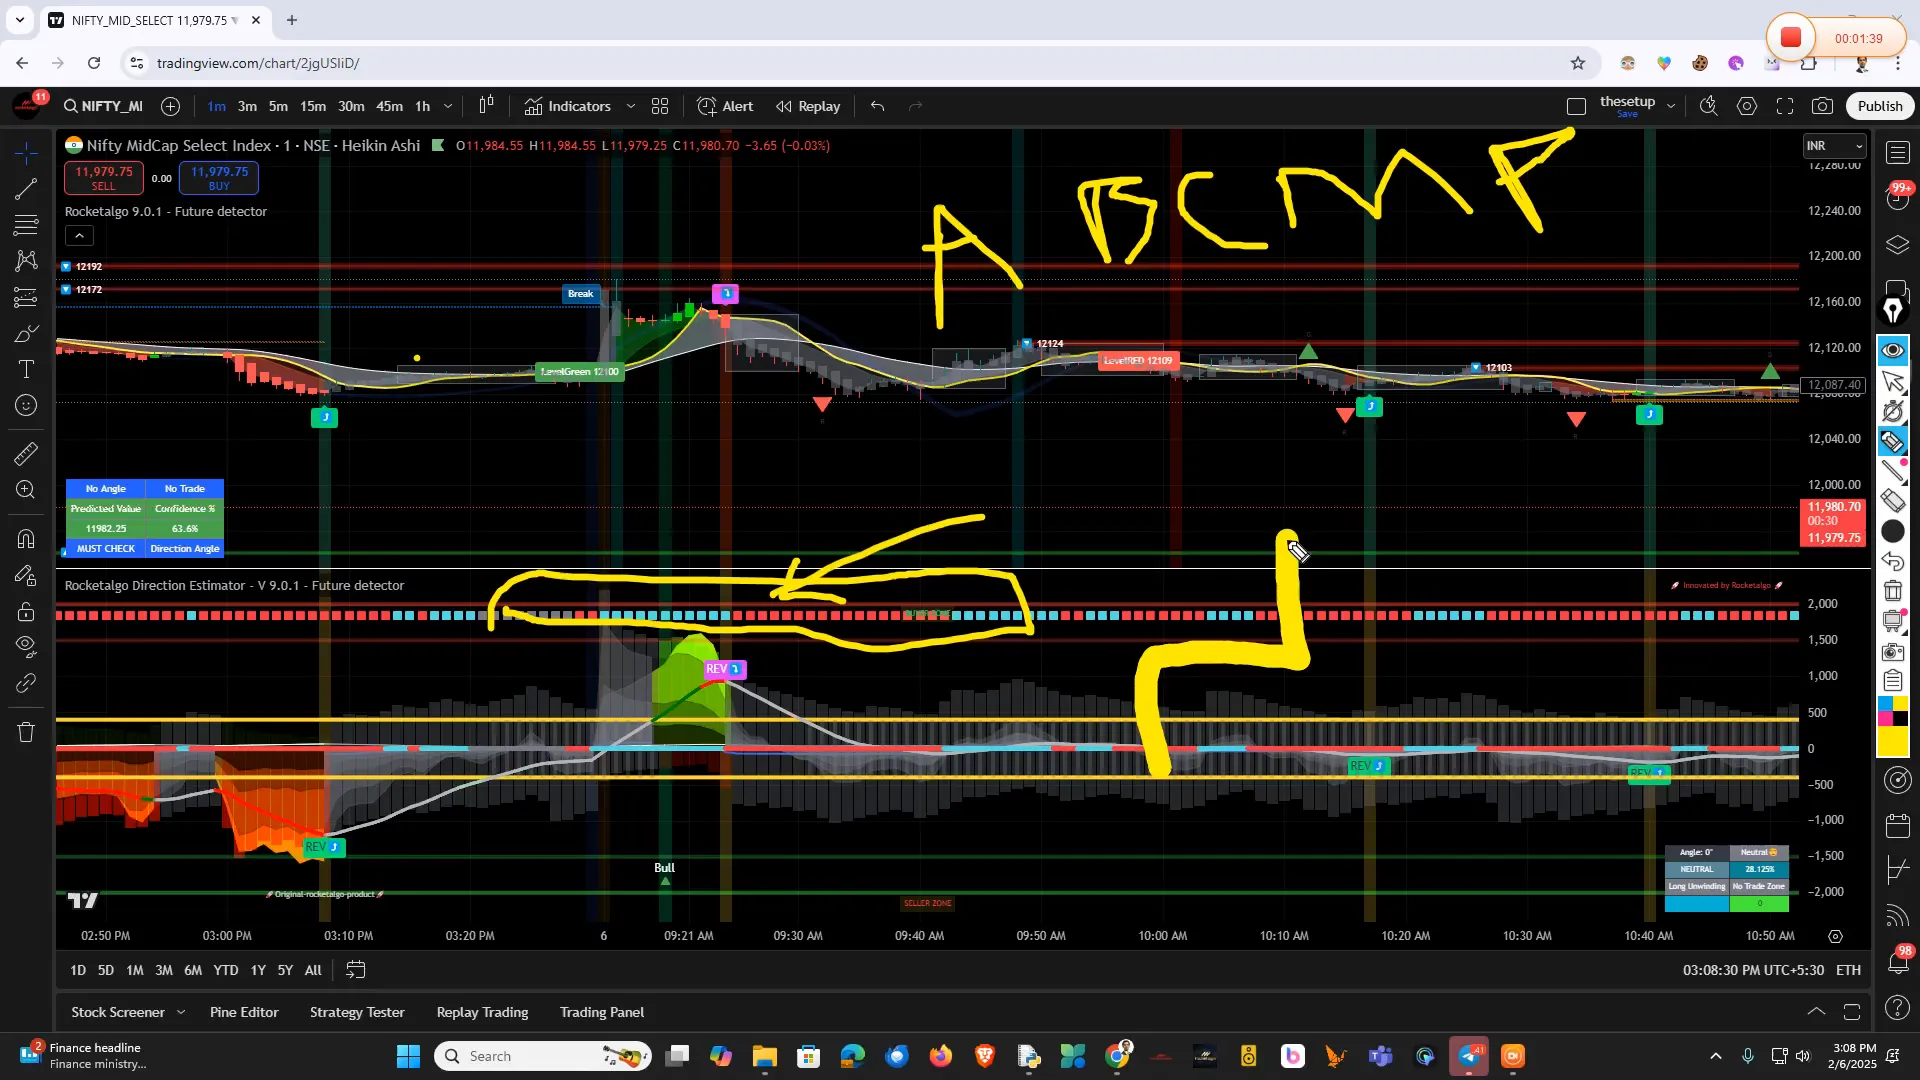
Money Flow (M) and Percentage (P) further validate our setup. These elements ensure that we are not only following the trend but also that there is enough volume supporting our trades.
💡 Identifying Trade Opportunities
In today's session, we will identify potential trade opportunities based on the ABCMP conditions. When all criteria align, it is a strong indication to enter a trade. For instance, if we see a strong angle, a confirmed breakout, and climbing candles, it’s time to consider taking a position.
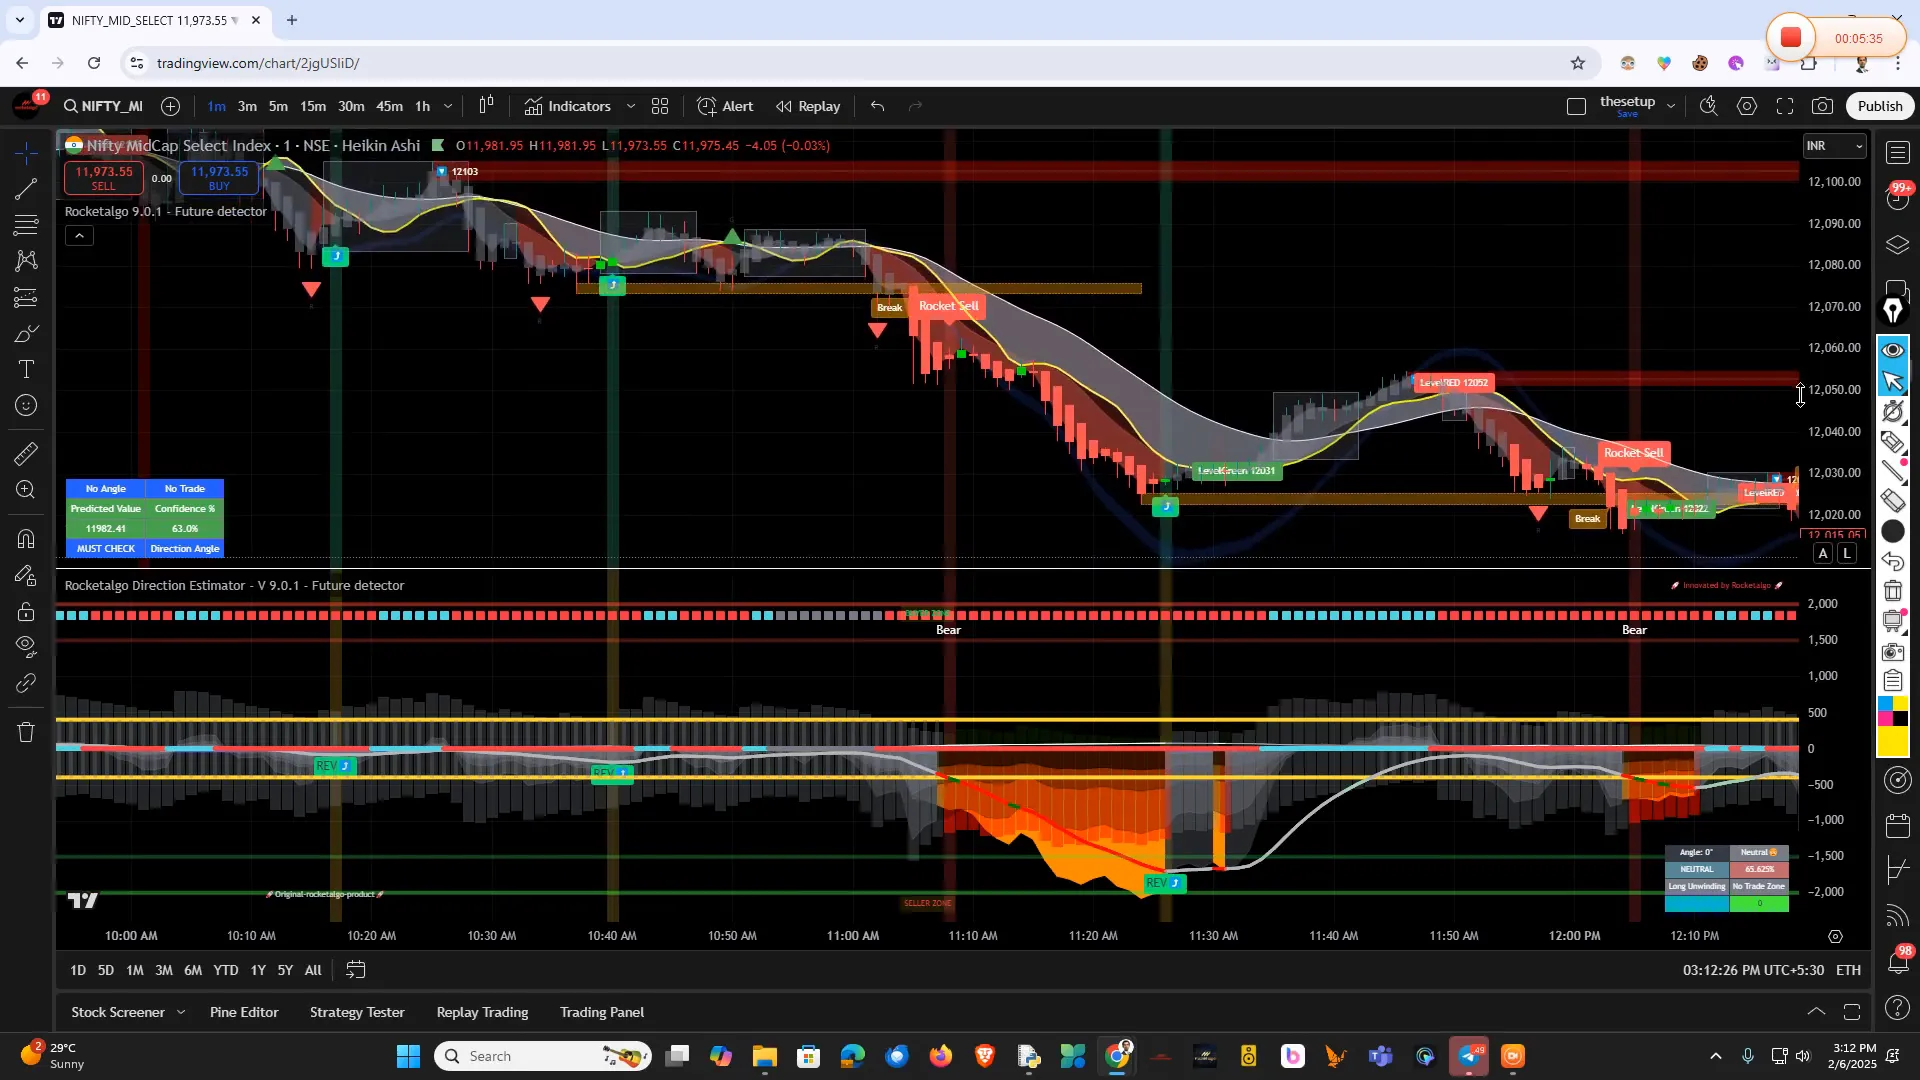
However, if we encounter three-candle traps or sideways movement, it’s wise to reassess our strategy. The market can often present traps that can lead to losses if we’re not careful. Always remember to protect your capital and avoid unnecessary risks.
⚠️ Navigating Risk in Trading
Risk management is crucial in trading. Understanding when to enter and exit trades can make all the difference. If the market shows signs of volatility or uncertainty, it’s best to wait for clearer signals before making moves.
For high-risk traders, it's essential to set strict stop-loss orders to protect your investments. Conversely, low-risk traders should focus on consistent, smaller profits rather than chasing big wins, which can lead to significant losses.
As we analyze the Nifty and Bank Nifty, we’ll look for patterns that indicate when to trade and when to hold back. For instance, if the market opens with a gap and shows signs of reversal, it’s a signal to be cautious.
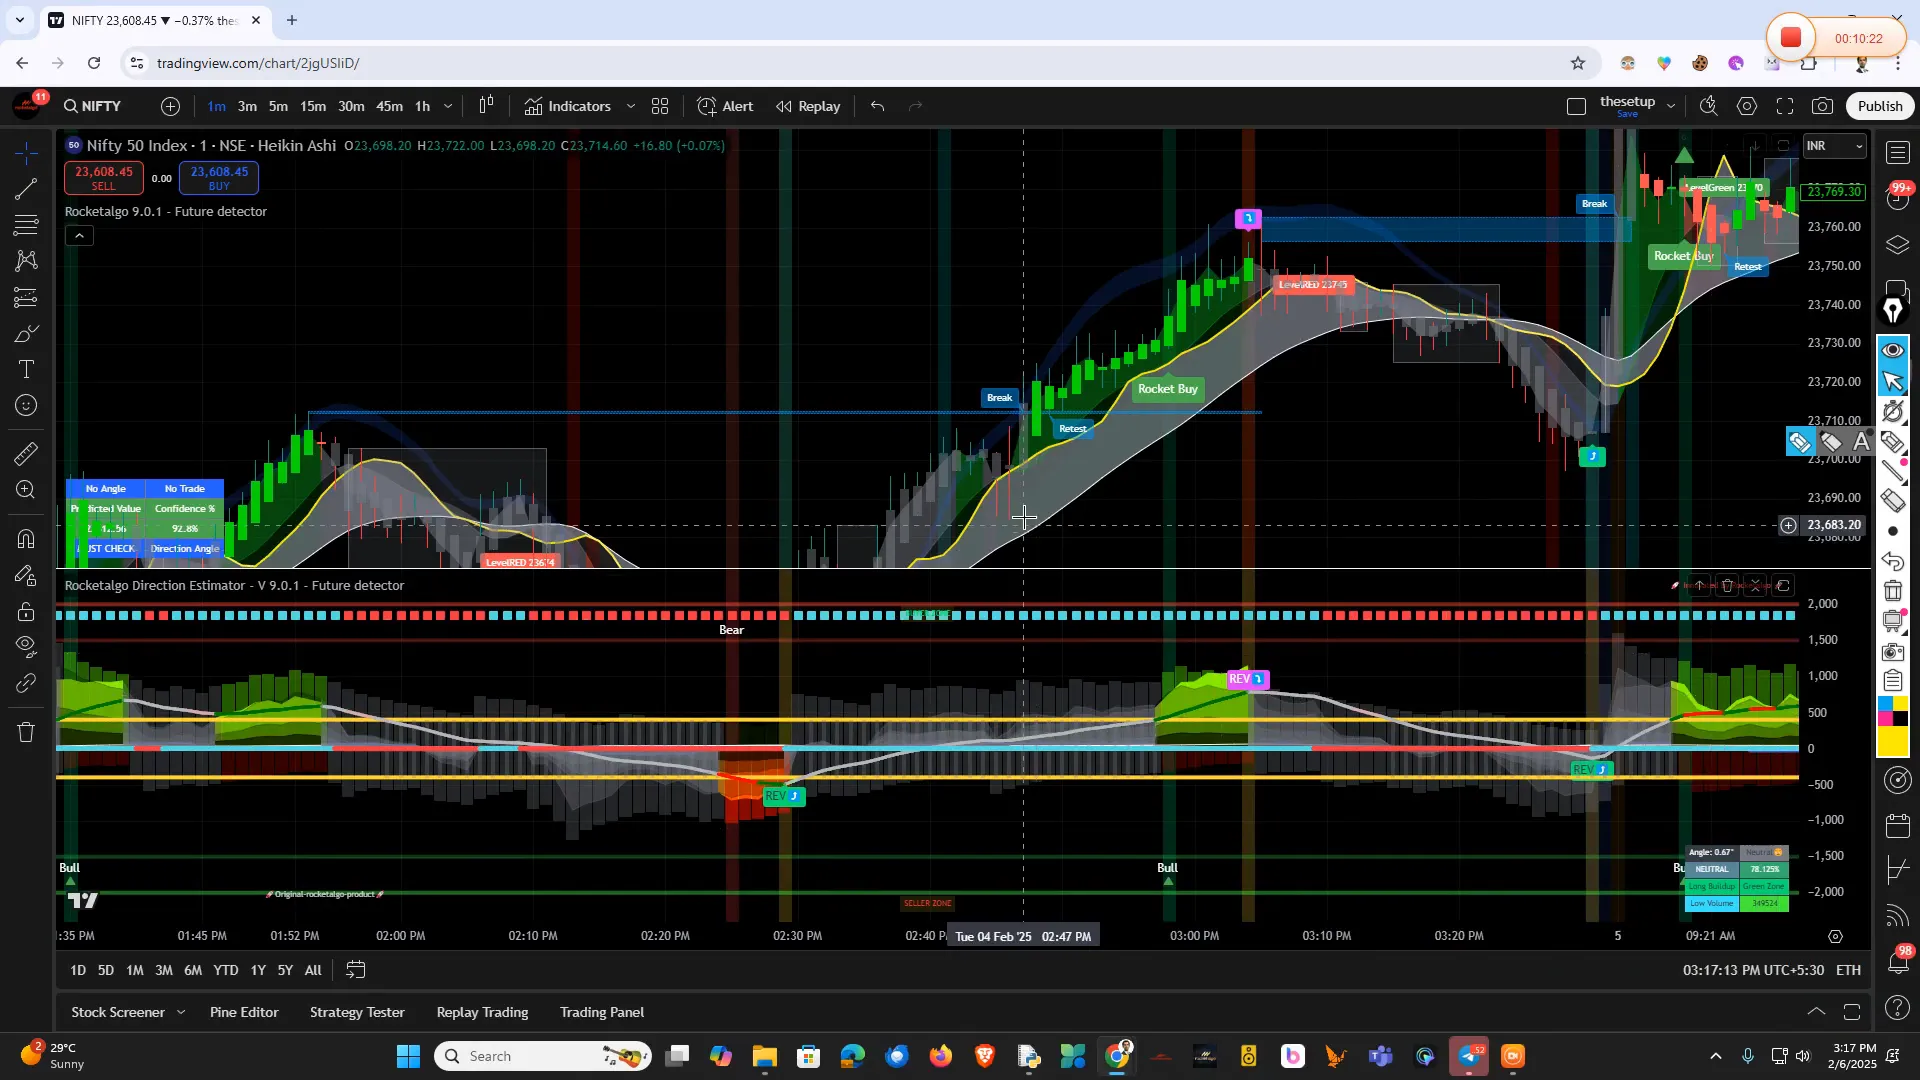
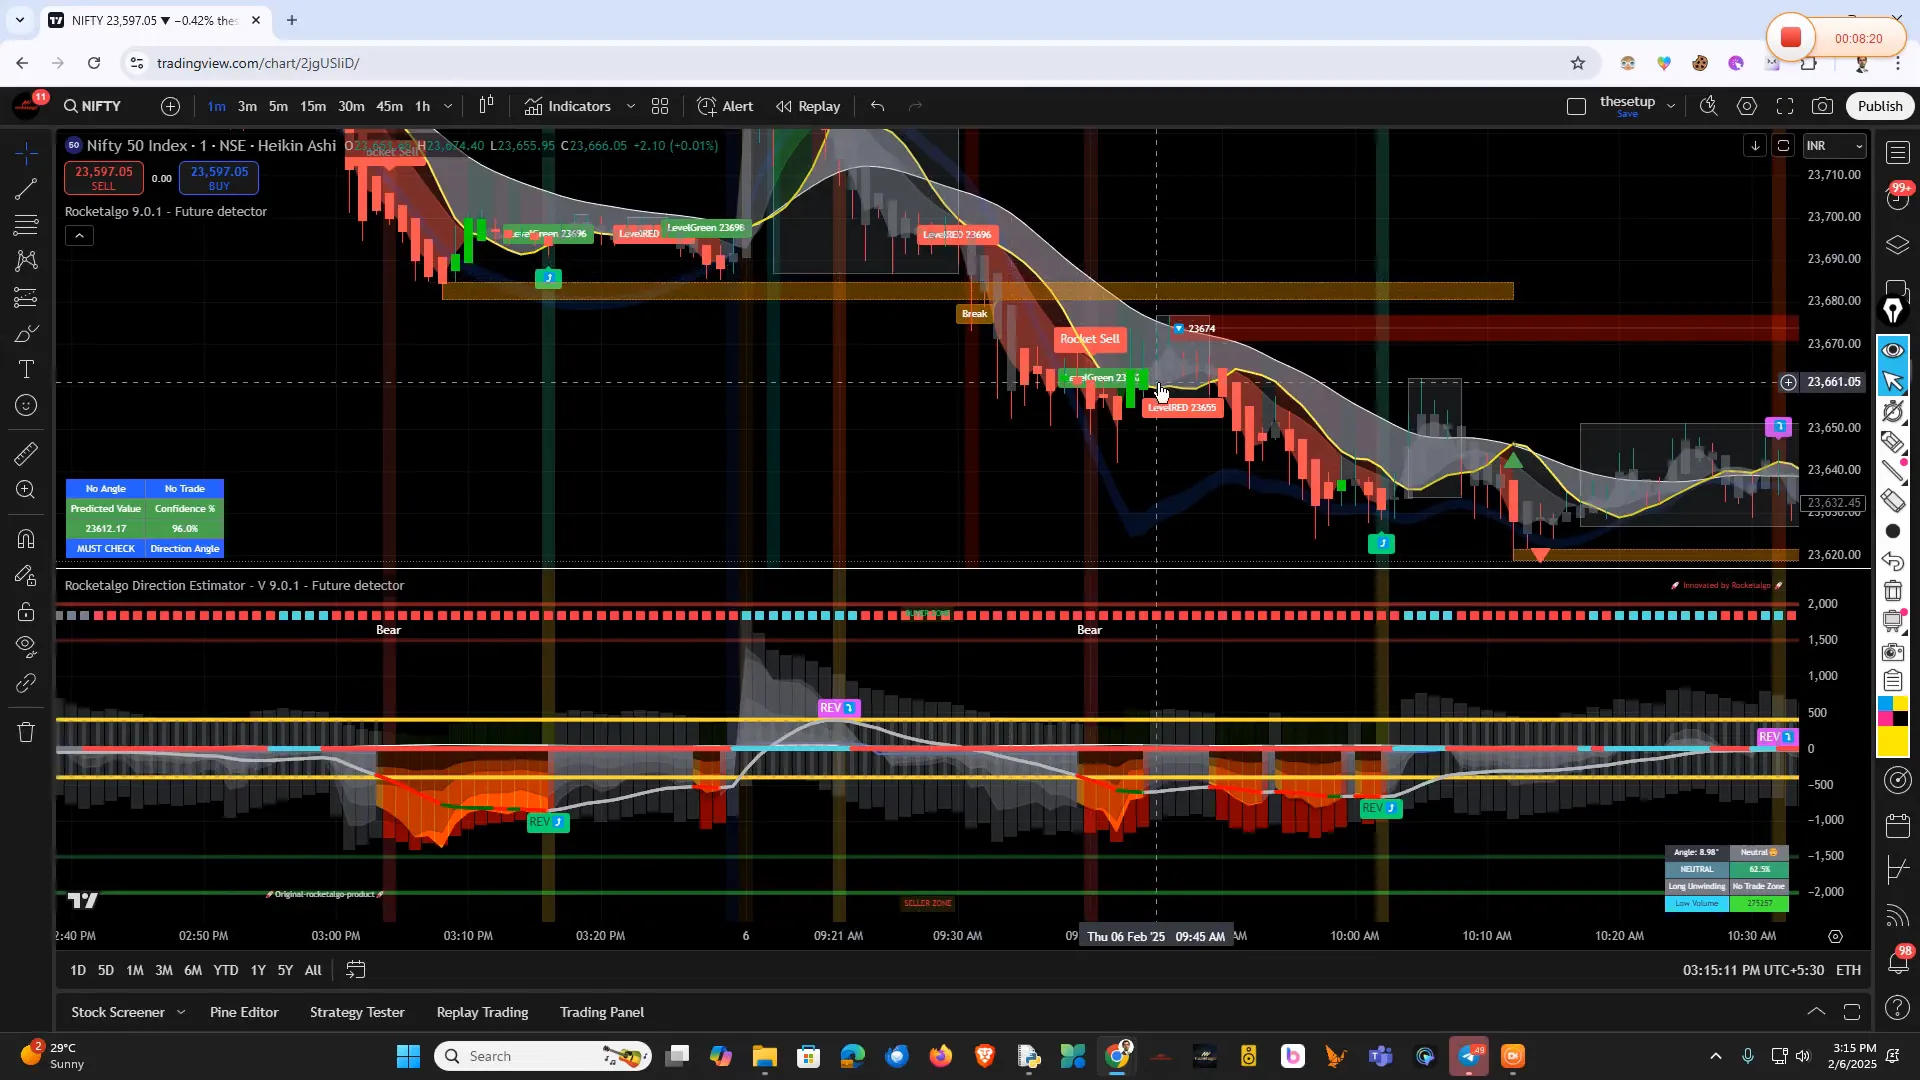
📈 The Current State of Nifty and Bank Nifty
The Nifty index has been experiencing a sideways trend, indicating a lack of clear direction in the market. This can often lead to confusion for traders trying to identify entry points. As we analyze the charts, it's crucial to look for patterns that suggest potential breakouts.
In contrast, the Bank Nifty has shown some volatility, with gaps appearing at the market open. This behavior can be indicative of profit booking and market corrections. Traders should remain cautious and monitor the first few candles after the market opens to avoid getting trapped in unfavorable trades.
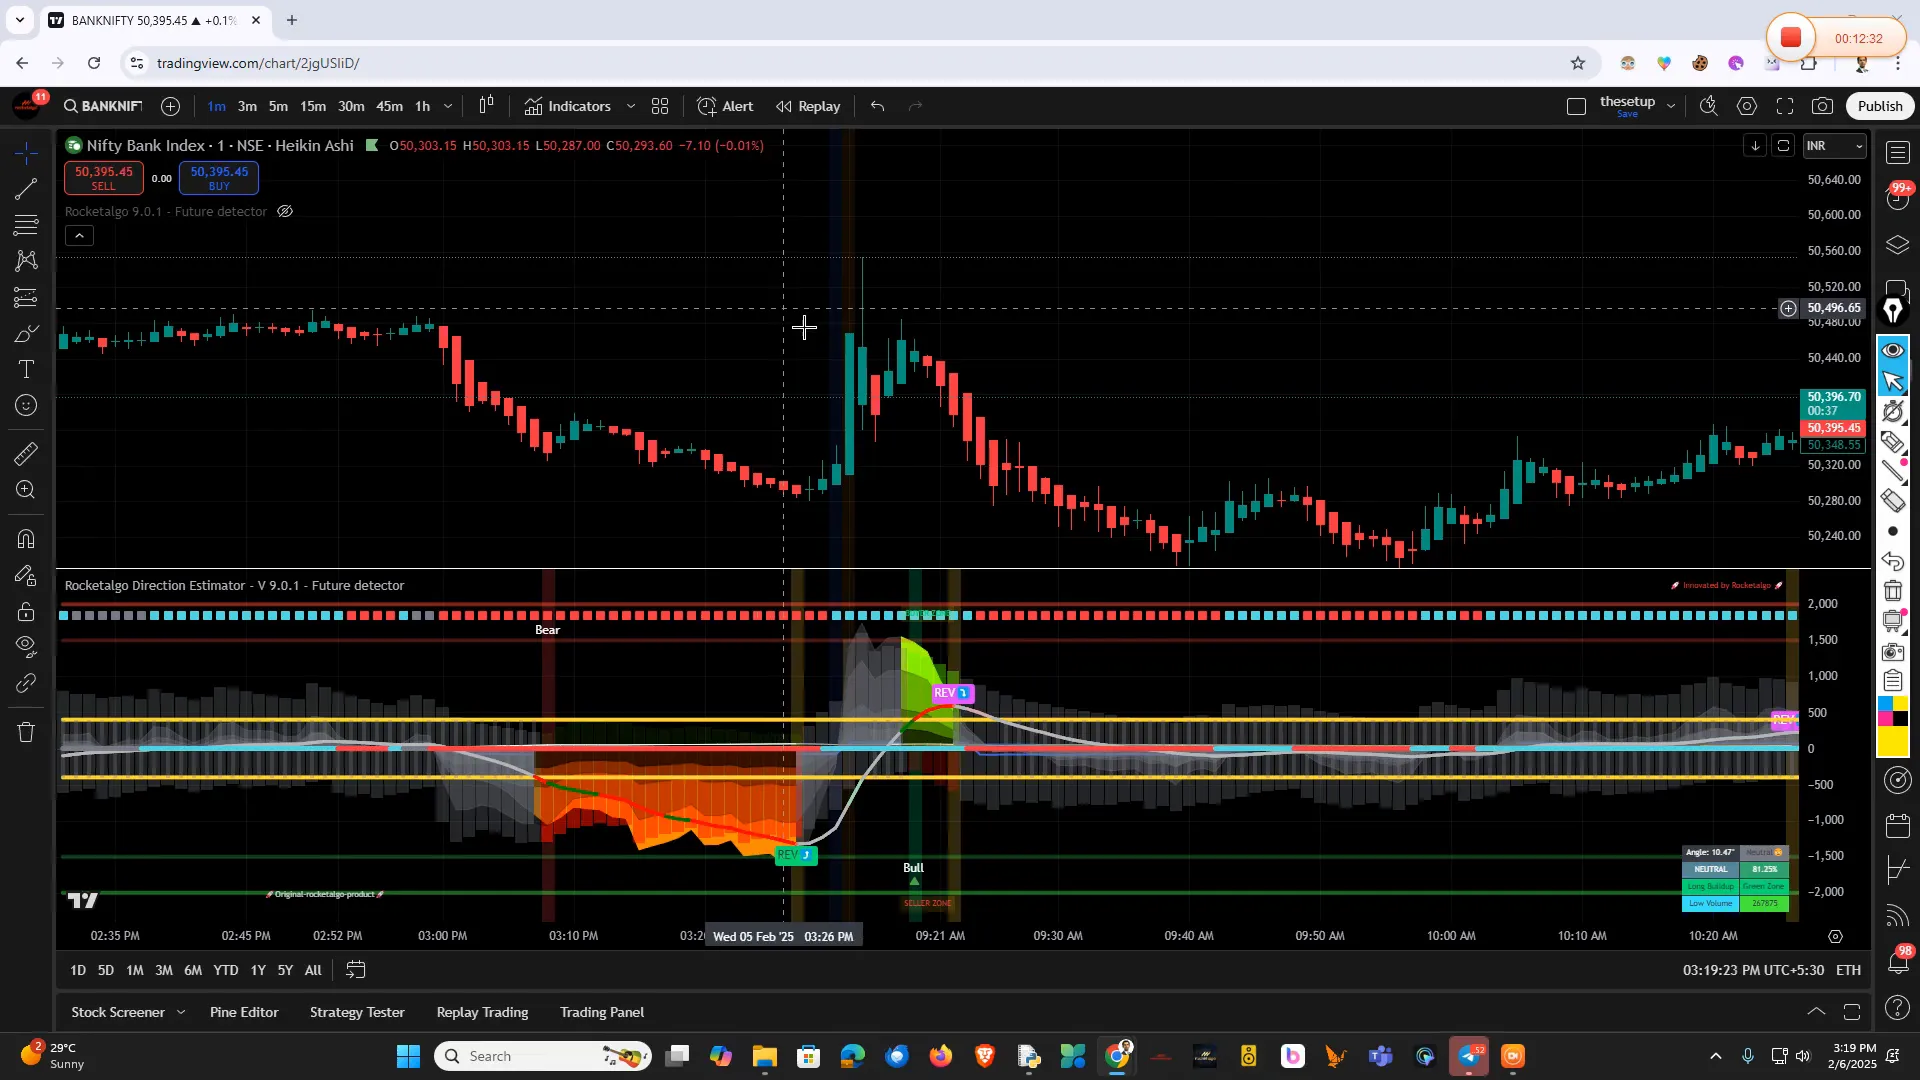
Understanding the current market sentiment is vital. If the Nifty is stuck in a range while the Bank Nifty shows movement, it may signal a potential shift in momentum that traders can capitalize on. Look for confirmation through our Rocketalgo setup to validate your trades.
⏰ Market Opening Strategy: Timing is Key
Timing your trades is essential for success in the stock market. The first few minutes after market open can be particularly volatile. Many traders make the mistake of entering trades too early, leading to unnecessary losses.
To mitigate risk, it's advisable to wait for at least the first 15 minutes before making any trading decisions. This allows you to observe the market's initial direction and avoid getting caught in false moves.

Additionally, setting alerts for significant price movements can help you catch opportunities without the need to monitor every tick. By waiting for the market to settle, you can make more informed decisions based on clearer signals.
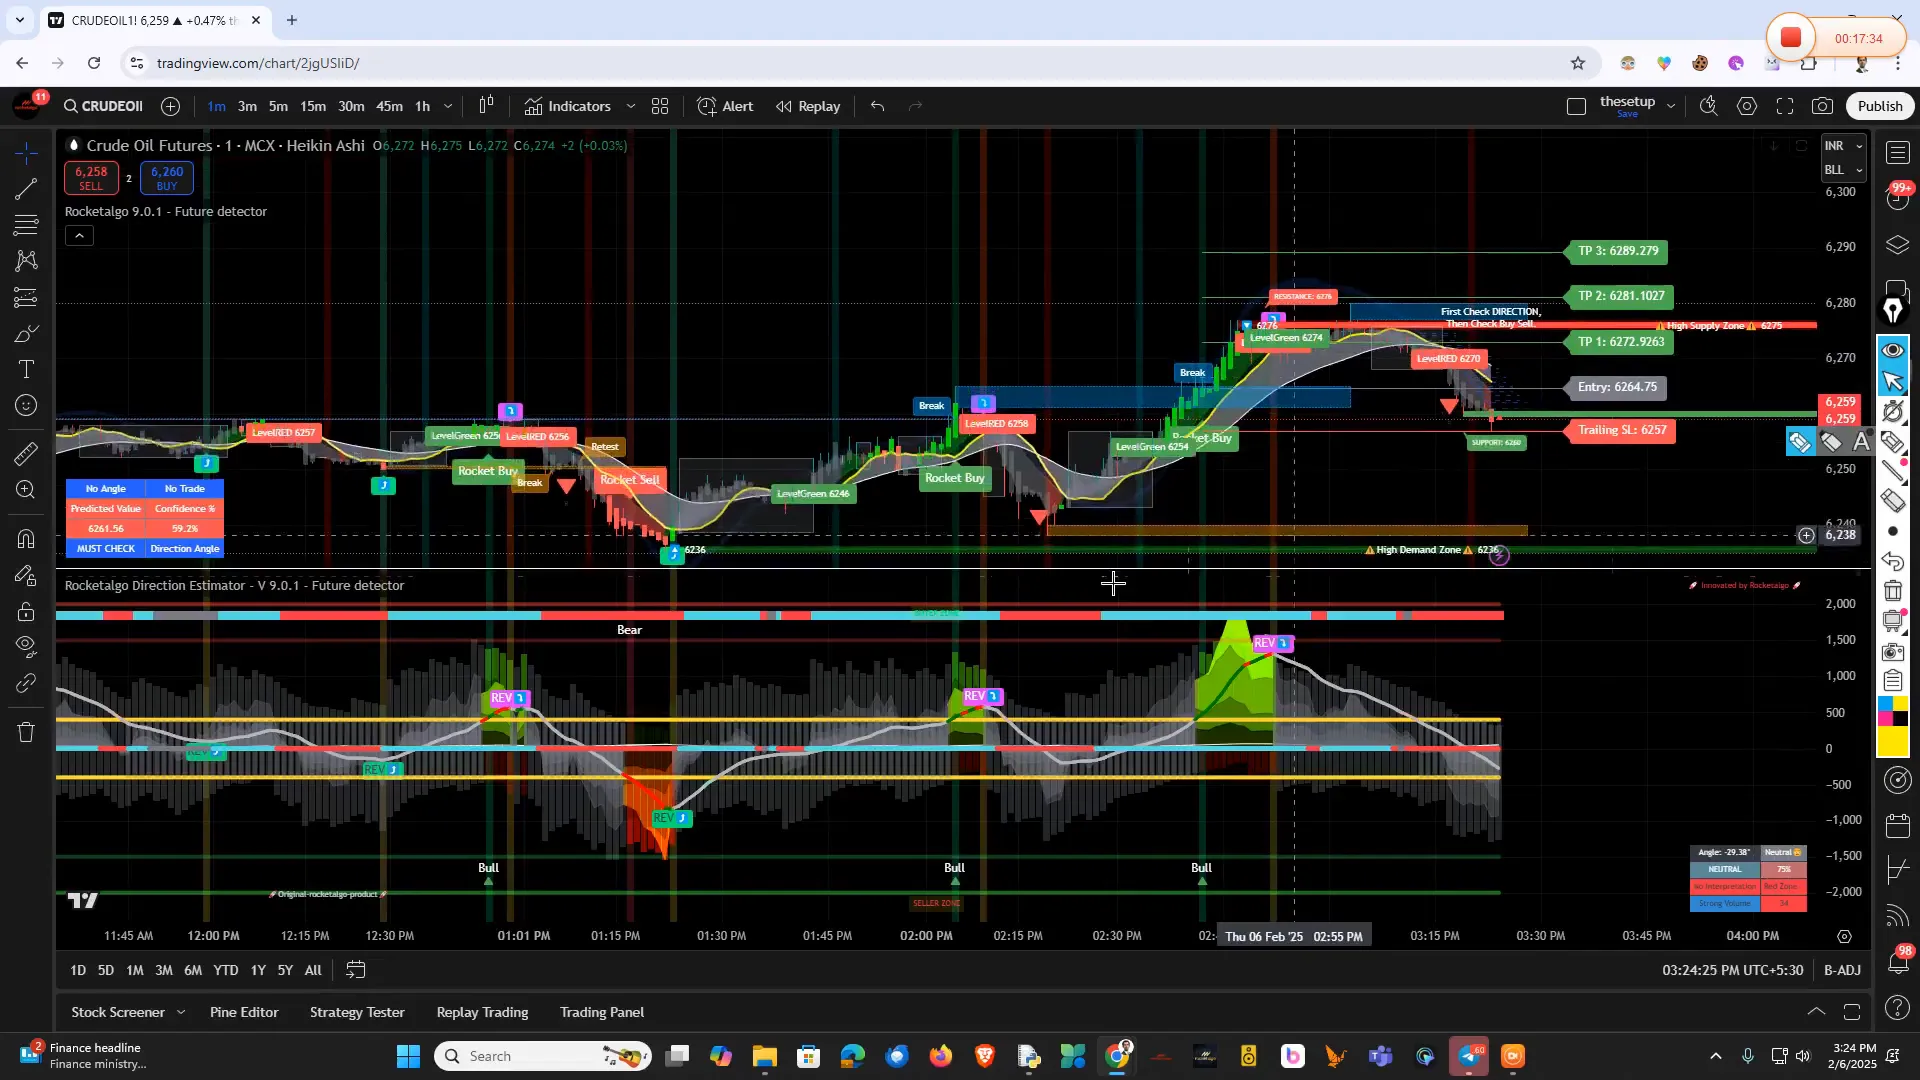
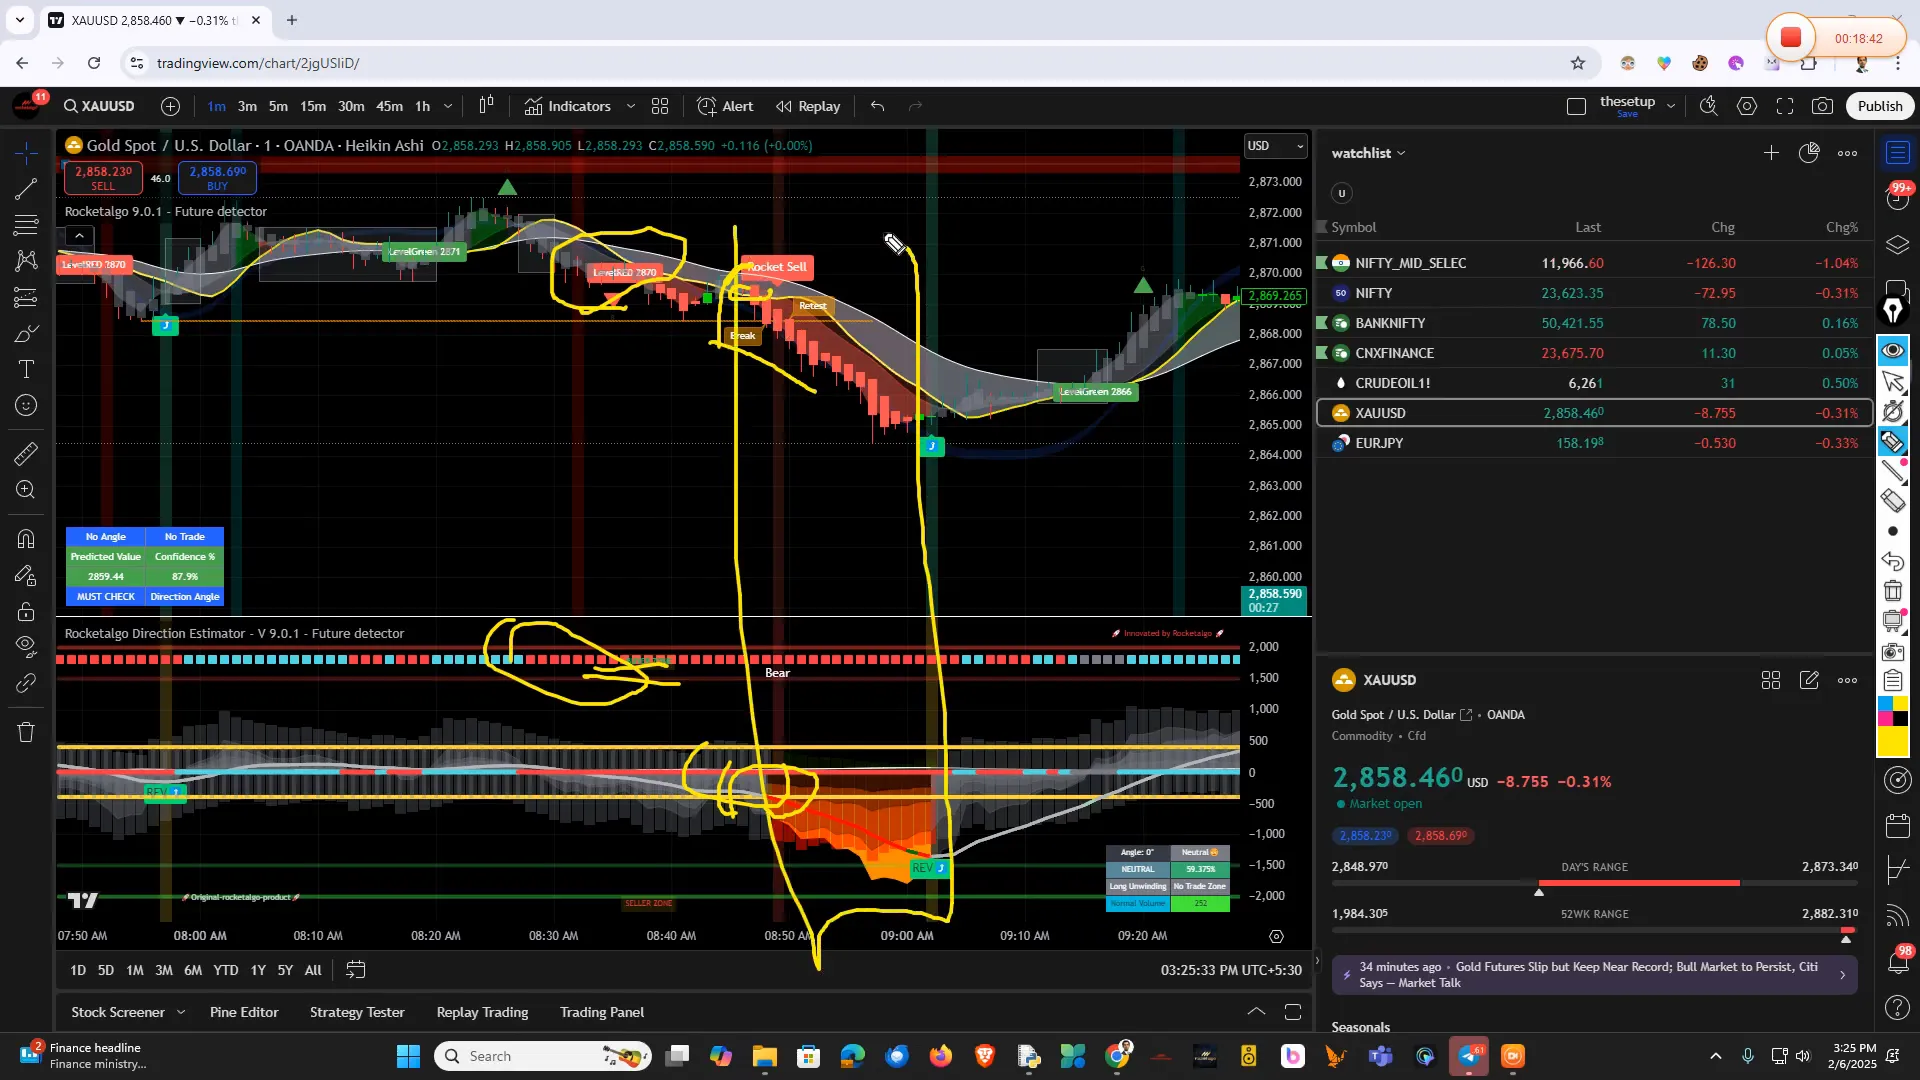
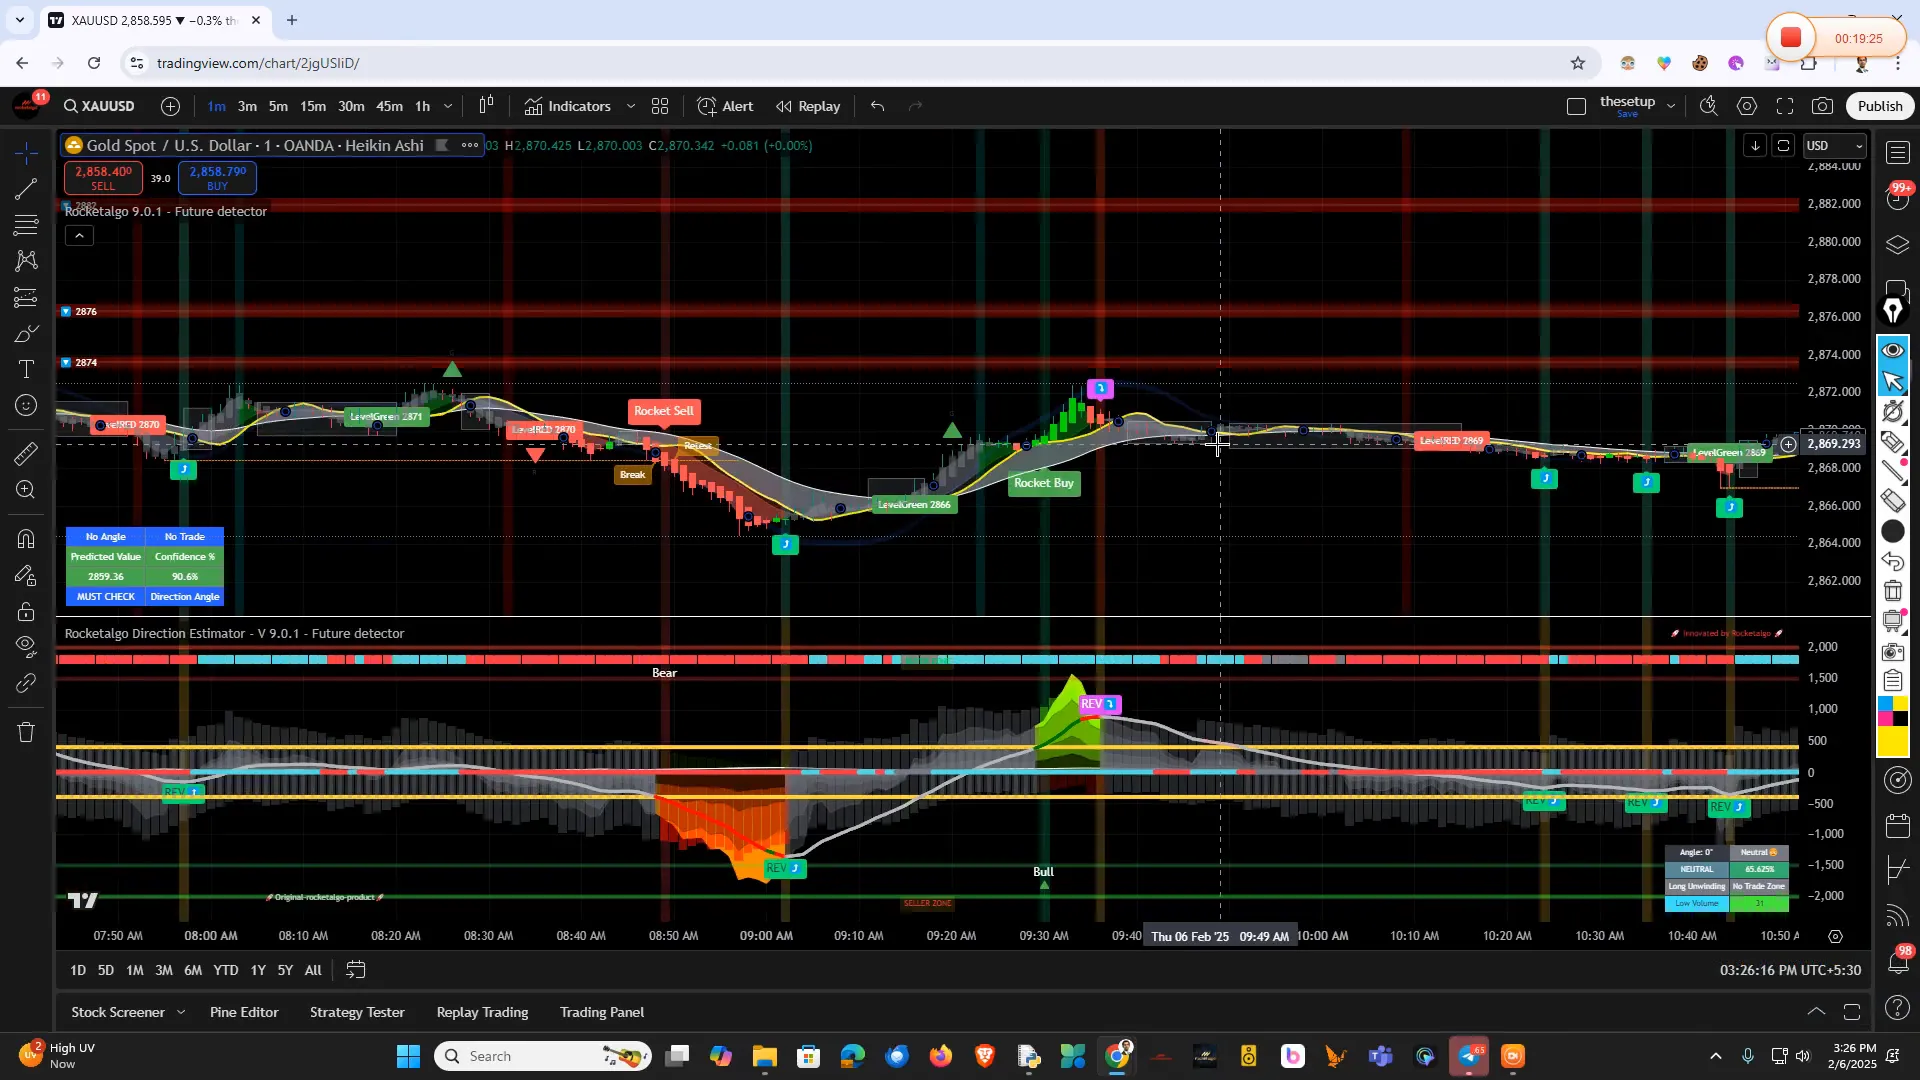
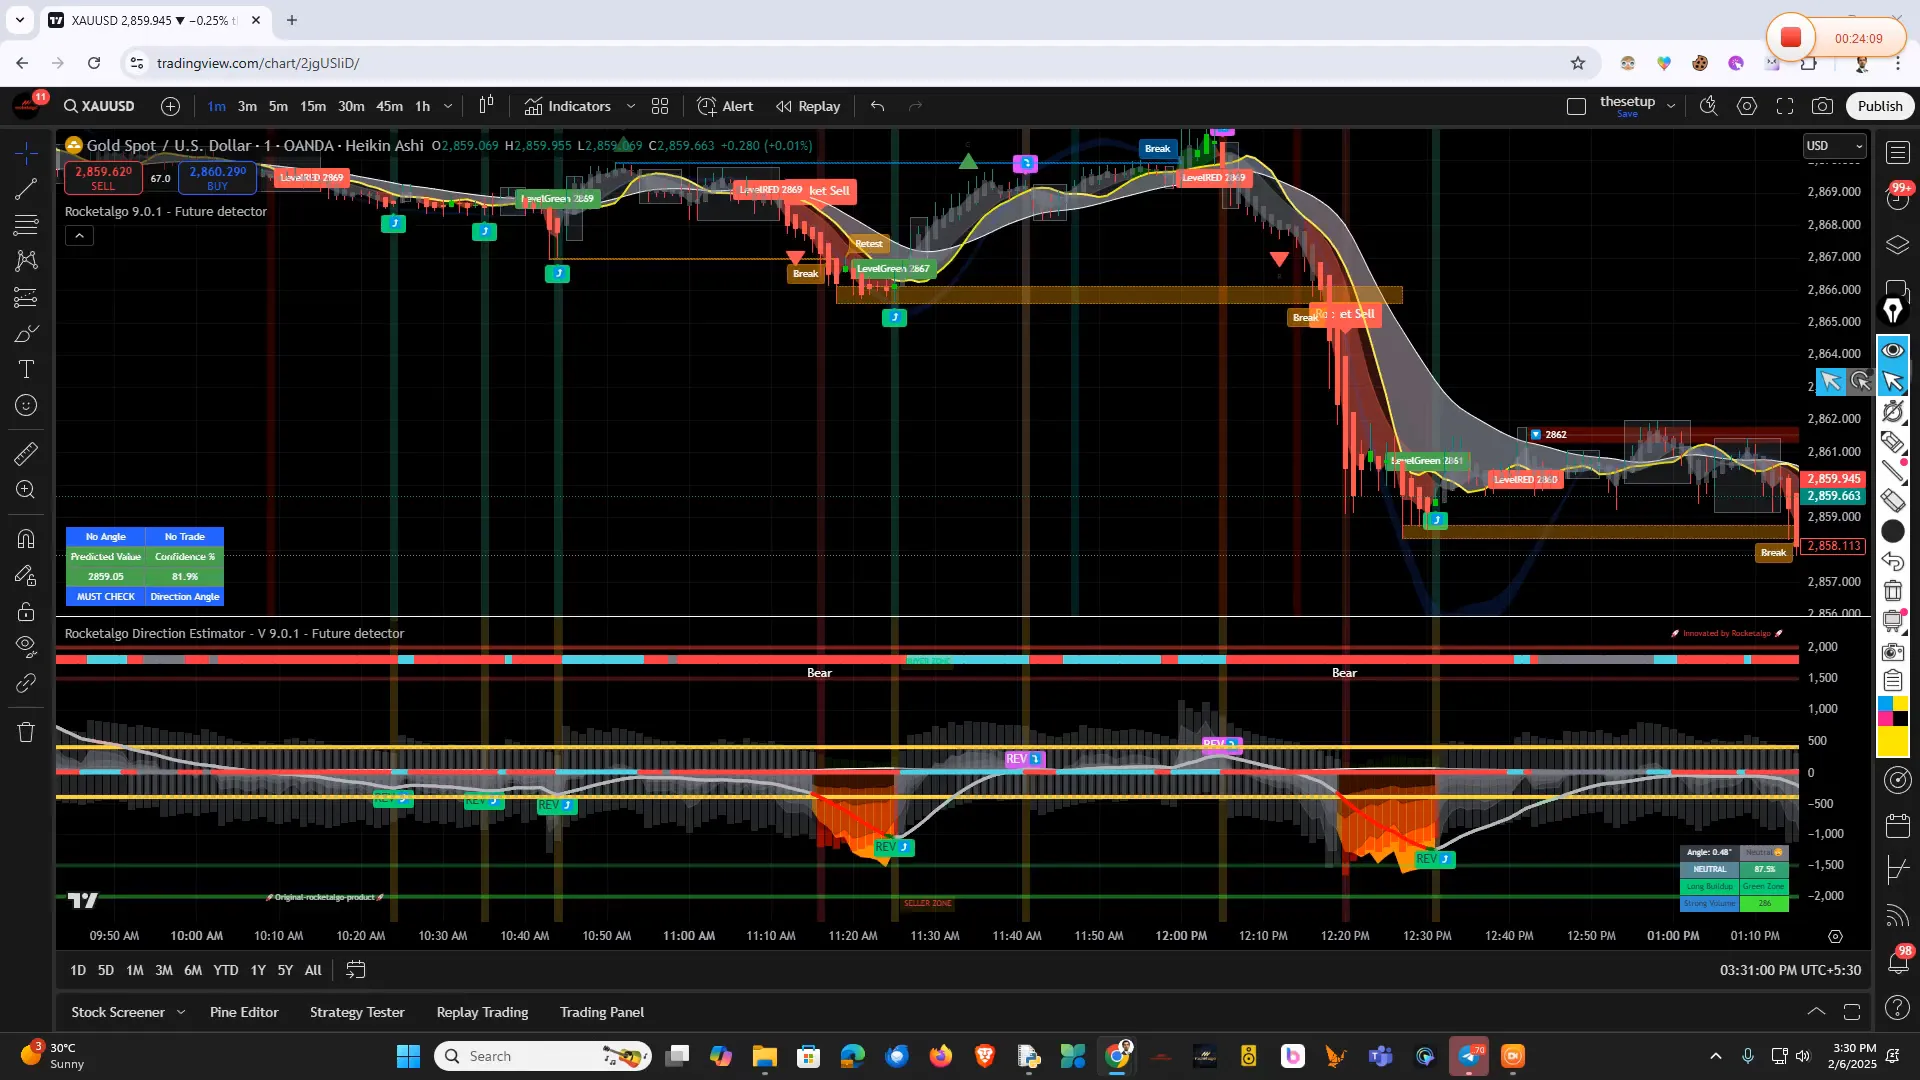
🛢️ Crude Oil and Gold Market Analysis
Crude oil has been on a bullish trend, with recent trades showing solid breakout patterns. Traders should keep an eye on key resistance levels, as these can provide excellent entry points for long positions.
In the gold market, similar patterns are emerging. The recent analysis indicates a potential downtrend, with the Rocketalgo setup highlighting key indicators for entry and exit points. Traders should remain vigilant and adjust their strategies accordingly to maximize profits.
🚀 Future Features and Enhancements in Rocketalgo
We're excited to announce upcoming features in Rocketalgo that will enhance your trading experience. These enhancements aim to provide more precise indicators and streamline the trading process.
Our team is currently testing these features to ensure they meet the high standards our users expect. Stay tuned for updates as we roll out these improvements in the coming weeks!
🔚 Conclusion and Q&A Session
As we wrap up today's session, remember that patience and analysis are key to successful trading. The market's current state may appear uncertain, but with the right strategies and tools, you can navigate through it effectively.
Now, let's open the floor for questions. If you have any specific queries about your trading strategies or the Rocketalgo setup, feel free to ask!
.jpg?alt=media&token=7e7f106e-ca8b-4cb2-9d13-2669607bd336/)
❓ FAQ
- What is the best time to trade?
The best time to trade is usually after the first 15 minutes of market open when the volatility stabilizes. - How can I manage risk while trading?
Always set stop-loss orders and avoid entering trades during high volatility unless you are experienced. - What tools can enhance my trading strategy?
Utilizing a comprehensive tool like Rocketalgo can provide valuable insights and improve your trading decisions. - How often should I analyze the market?
Regular analysis is crucial, but focus on key trends and significant price movements rather than every tick.


